
15 Graphs You Need to See to Understand AI in 2021
The 2021 AI Index provides insight into jobs, publications, diversity, and more
If you haven’t had time to read the AI Index Report for 2021, which clocks in at 222 pages, don’t worry—we’ve got you covered. The massive document, produced by the Stanford Institute for Human-Centered Artificial Intelligence, is packed full of data and graphs, and we’ve plucked out 15 that provide a snapshot of the current state of AI.
Deeply interested readers can dive into the report to learn more; it contains chapters on R&D, technical performance, the economy, AI education, ethical challenges of AI applications, diversity in AI, and AI policy and national strategies.
1. We’re Living in an AI Summer
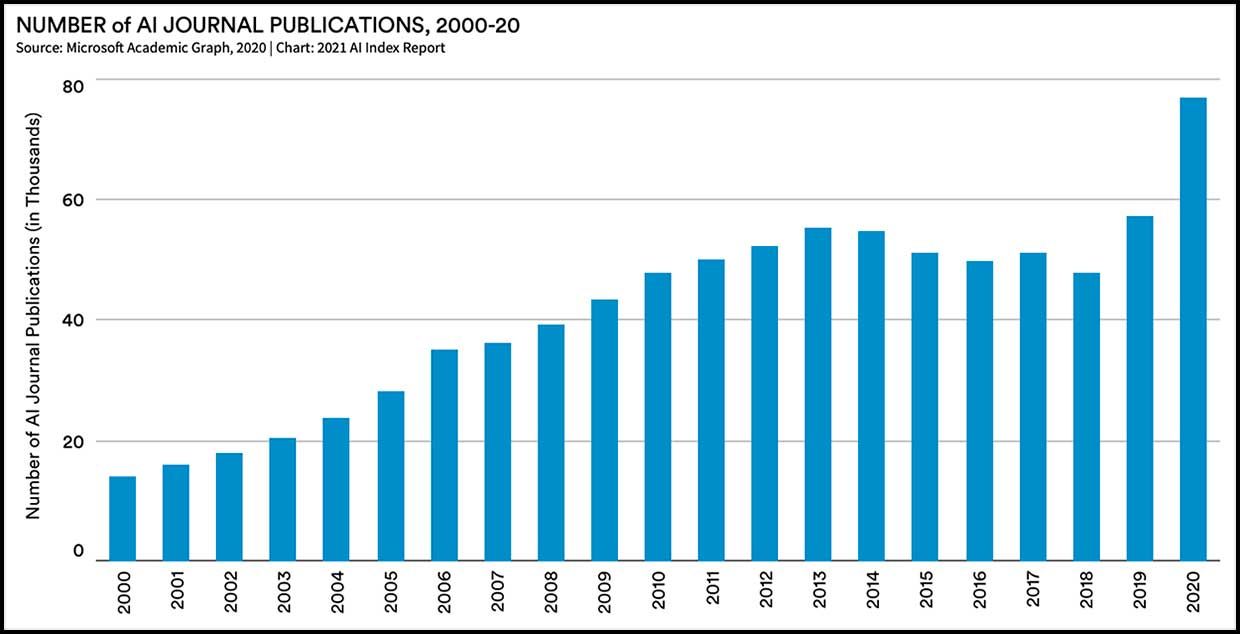
AI research is booming: More than 120,000 peer-reviewed AI papers were published in 2019. The report also notes that between 2000 and 2019, AI papers went from being 0.8 percent of all peer-reviewed papers to 3.8 percent in 2019.
2. China Takes Top Citation Honors
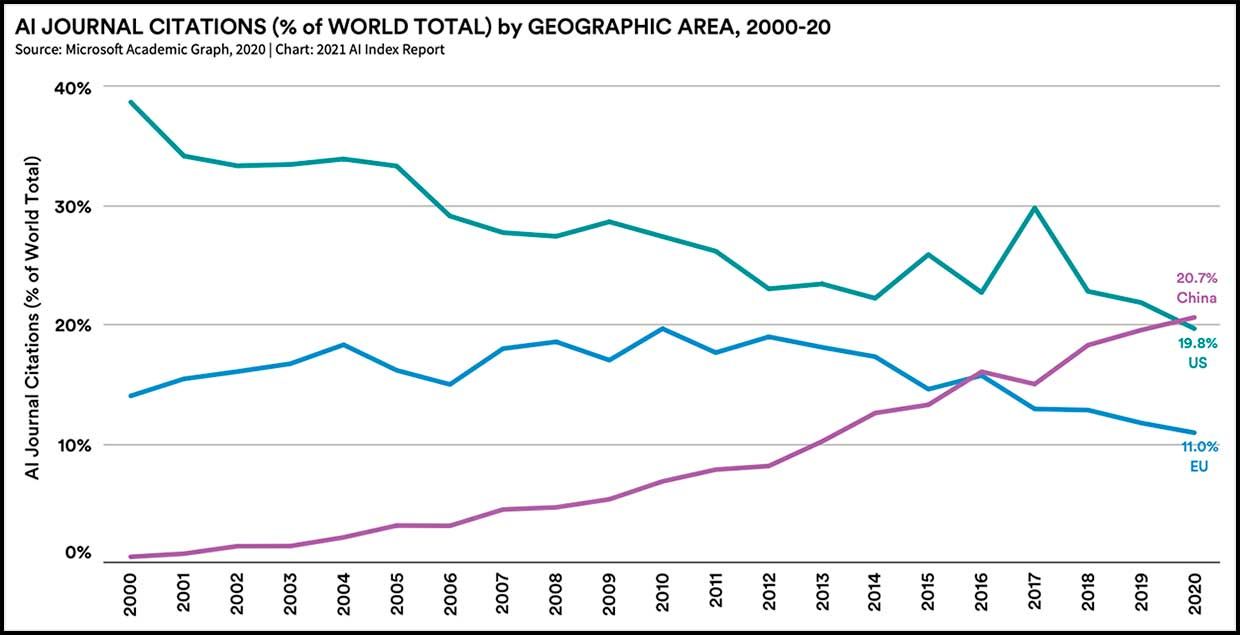
It’s old news that Chinese researchers are publishing the most peer-reviewed papers on AI—China took that lead in 2017. The news this year is that, as of 2020, papers by Chinese researchers that were published in AI journals are receiving the largest share of citations.
Jack Clark, codirector of the AI Index Steering Committee, tells IEEE Spectrum that the data seems like “an indicator of academic success” for China, and is also a reflection of different AI ecosystems in different countries. “China has a stated policy of getting journal publications,” he notes, and government agencies play a larger role in research, whereas in the United States, a good portion of R&D happens within corporations. “If you’re an industry, you have less incentive to do journal articles,” he says. “It’s more of a prestige thing.”
3. Faster Training = Better AI

This data comes from MLPerf, an effort to objectively rank the performance of machine learning systems. Image classifier systems from a variety of companies were trained on the standard ImageNet database, and ranked on the amount of time it took to train them. In 2018, it took 6.2 minutes to train the best system; in 2020 it took 47 seconds. This extraordinary improvement was enabled by the adoption of accelerator chips that are specifically designed for machine learning.
The report states the impact of this speedup: “Imagine the difference between waiting a few seconds for a system to train versus waiting a few hours, and what that difference means for the type and volume of ideas researchers explore and how risky they might be.” [READ MORE]
Comments :