
The Engineer’s Guide to TDA: Decoding Topological Data Analysis
By: A Fellow Math Enthusiast
Target Audience: Data Scientists, Systems Engineers
Introduction: Data Has a Shape
Standard statistics (mean, variance) treats data like a cloud of dust. But data often has structure: loops, voids, and tunnels. Topological Data Analysis (TDA) is the math of figuring out the “shape” of your data, which is incredibly useful for detecting anomalies in sensor networks or classifying complex molecules.
The Syllabus Map
| Your Bachelor’s Subject | The TDA Implementation |
| Linear Algebra | Gaussian Elimination (Smith Normal Form) |
| Discrete Math | Simplicial Complexes (Connecting the Dots) |
| Set Theory | Filtration (Growing the Shapes) |
| Abstract Algebra | Homology Groups (Counting the Holes) |
| Metric Spaces | Distance Functions (Measuring Similarity) |
The Breakdown
- Discrete Math (Simplicial Complexes)
-
- The Component: Building the shape.
- The Math: You treat data points as vertices. If two points are close, you draw an edge. If three are close, you fill in a triangle (a face). This structure is called a Simplicial Complex. It is essentially graph theory on steroids.
- Abstract Algebra (Homology)
-
- The Component: Finding the features.
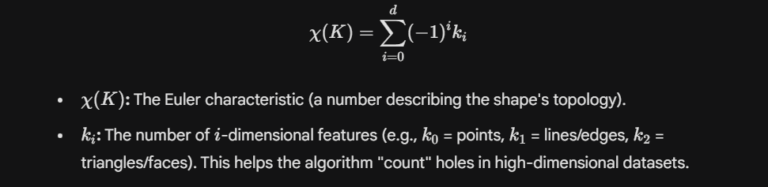
- The Math: How do you define a “hole” mathematically? You use Homology Groups (H_0, H_1, H_2).
- H_0: Connected components (clusters).
- H_1: Loops (cycles).
- H_2: Voids (bubbles).
- You are essentially counting independent features in vector spaces.
- Linear Algebra (The Calculation)
-
- The Component: Computing “Persistence.”
- The Math: Surprisingly, TDA is mostly just Matrix Reduction (Gaussian Elimination). You build a massive “Boundary Matrix” representing the connections, and you reduce it to find which holes “persist” over a long range of scales and which ones are just noise.

Comments :