
Match Analysis Software: Decoding the Beautiful Game
Match analysis software has evolved from simple video playback to complex, AI-driven platforms that act as the tactical brain of a coaching staff. The shift from manual video tagging to sophisticated, automated computer vision systems became prominent in the mid-to-late 2010s. Companies like Hudl (Sportscode), Opta, and Wyscout have created tools that process match footage to extract a level of tactical detail that was previously impossible to gather manually.
The main problem this software solves is the overwhelming volume and complexity of tactical data in a football match. A 90-minute game contains thousands of individual events—passes, tackles, runs, interceptions. For a coach to manually watch, tag, and analyze all this for their own team and upcoming opponents is an insurmountable task. There was a massive gap between what happened on the pitch and the coaching staff’s ability to quantify and understand it quickly enough to prepare for the next game.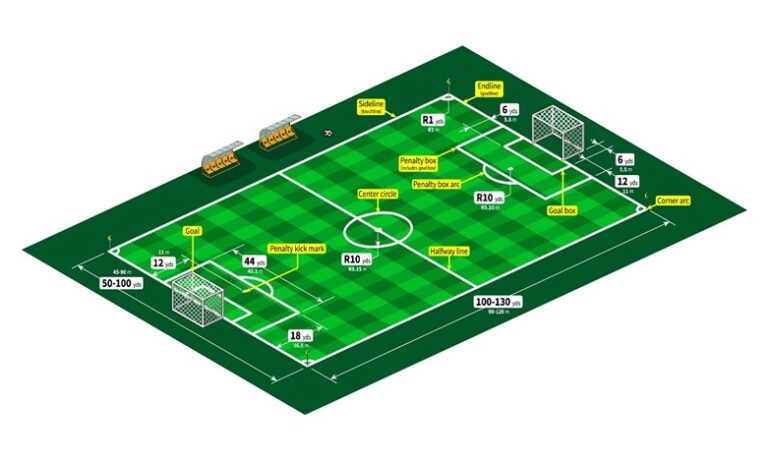
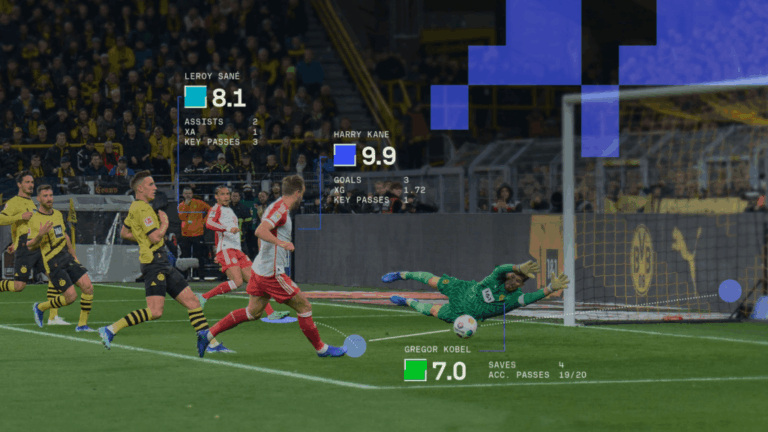
Match analysis software makes the sporting world better by automating the data collection process and providing powerful visualization tools. Using computer vision, the software can automatically track every player and the ball, generating 2D or 3D recreations of the match. This allows coaches to instantly pull up video clips of every defensive transition, generate heatmaps of a specific opponent player’s movement, analyze passing networks to see who influences the game most, and assess team formations in different phases of play. It turns hours of video into actionable tactical insights in minutes.
Here is a deep dive into the “brain” and “hands” of football analytics.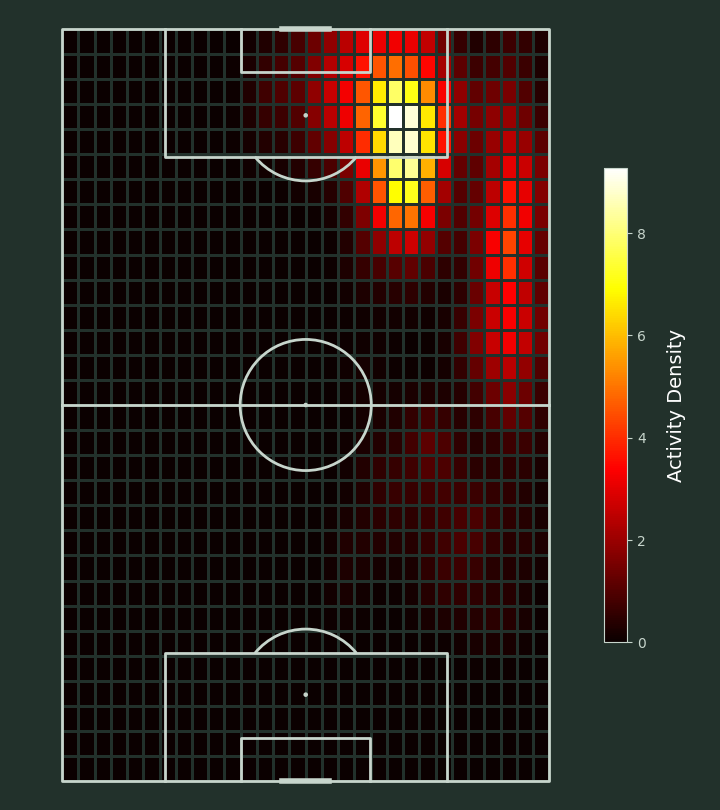
Part 1: The Algorithms (The “Brain”)
Football analytics relies on two main families of algorithms: Computer Vision (to see the game) and Machine Learning (to understand it).
1. Computer Vision (The “Eyes”)
This is how a computer watches a video feed and turns pixels into data.
-
Object Detection (YOLO – “You Only Look Once”): This is the industry-standard algorithm for detecting objects in real-time. It scans a frame and instantly draws a bounding box around every player, the ball, and the referee.
-
Object Tracking (Deep SORT & Kalman Filters): Detection isn’t enough; the computer needs to know that “Player A” in frame 1 is still “Player A” in frame 100. Kalman Filters predict where a player should be in the next frame based on their current speed and trajectory. If the detection is slightly off, the filter corrects it.
-
Homography: This is a geometric algorithm that maps the angled TV view of the pitch onto a flat, 2D “top-down” map (x,y coordinates). It uses the white pitch lines as reference points to distort the image correctly so accurate distances can be measured.
2. Machine Learning (The “Intelligence”)
Once the data is collected, these algorithms crunch the numbers.
-
Logistic Regression / XGBoost (for xG): To calculate Expected Goals (xG), engineers train models on thousands of historical shots. They use Logistic Regression or Gradient Boosting (XGBoost). The input features are distance to goal, angle, and body part. The output is a probability between 0 and 1.
-
Clustering (K-Means): This is used to categorize player styles. Instead of saying “he is a striker,” the algorithm groups players based on heatmaps and passing vectors. It might classify a player specifically as a “Deep-Lying Playmaker” mathematically.
Part 2: The “Inputer” (How Data is Entered)
You might think it’s all automated, but the most detailed data (Event Data) is still heavily reliant on humans. This role is often called a “Tagger” or “Data Collector.”
1. The Setup: “The Gamer”
Inputers for companies like Opta or StatsBomb work in a setup that looks like a high-end gaming rig.
-
The Hardware: They typically use three monitors. One has the live match feed, one has a grid representation of the pitch, and one feeds the data output.
-
The Controller: While some use a mouse, the pros use a keyboard with highly specialized Hotkeys. It is closer to playing a fast-paced RTS (Real-Time Strategy) game like StarCraft than typing in Excel.
2. The Workflow: “Click-Click-Type”
When a pass happens, the inputer doesn’t type “Pass by Messi.” They execute a rapid sequence, often in under a second:
-
Click Start: Click the location on the pitch grid where the pass started.
-
Hotkey Event: Press “P” (for Pass).
-
Click End: Click the location where the ball was received.
-
Hotkey Outcome: Press “S” (Successful) or “U” (Unsuccessful).
-
Modifier Keys: They might hold “Shift” to indicate it was a “Header” or “Ctrl” for a “Cross”.
This generates a row of data like: [Time: 14:02, Player: Messi, Event: Pass, Start_X: 45, Start_Y: 50, End_X: 60, End_Y: 40, Outcome: 1].
3. The “Hybrid” Future
While “Tracking Data” (positions of all 22 players) is now fully automated by optical cameras (TRACAB/Hawk-Eye), “Event Data” (passes, tackles, fouls) is still best done by humans because context is hard for AI. For example, AI struggles to differentiate between a “tackle” and a “blocked pass,” whereas a human spots the intent instantly.
The proof of its value is that no professional team today operates without a dedicated team of analysts using this software. The data is tangible: a coach can now see that an opponent attacks down the left flank
65% of the time, or that their own midfielder’s pass completion rate drops by 15% when under pressure in the final third. This data directly informs training-ground exercises, pre-match team talks, and in-game tactical adjustments, elevating the strategic level of the entire sport.

Comments :